Point and Figure (P&F) charts
Point and Figure (P&F) charts are a type of chart used in technical analysis to display the price movements of an asset. P&F charts differ from other charts in that they do not use a time-based axis, but instead use a simple X and O system to indicate price changes.
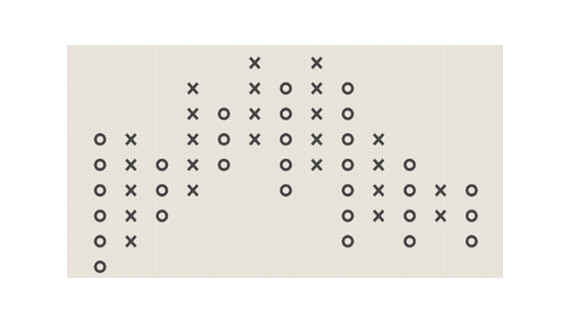
Here's how P&F charts work:
An X is placed on the chart to indicate an upward price movement.
An O is placed on the chart to indicate a downward price movement.
Boxes are created on the chart, with each box representing a specific price range.
The size of the box is determined by the price range and can be adjusted to create a more detailed or less detailed chart.
Advantages of P&F Charts:
1. Clear and easy to read: P&F charts are easy to read and understand. They provide a clear and concise visual representation of the price movements of an asset, making it easier for traders to identify patterns and trends.
2. No time axis: Since P&F charts do not use a time axis, they can be used to analyze price movements over any time period. This allows traders to analyze price movements over long periods without being influenced by short-term fluctuations.
3. Filter out the noise: P&F charts filter out minor price movements and focus only on significant price changes. This helps to reduce noise and provides a clearer picture of the overall trend.
4. Can be used with other indicators: P&F charts can be used in conjunction with other technical indicators to make more accurate trading decisions.
Disadvantages of P&F Charts:
1. Limited information: P&F charts do not provide as much information as other chart types. They do not show the opening, high, and low prices of an asset.
2. May not work for all assets: P&F charts may not work for all types of assets. For example, assets that are highly volatile or have frequent price fluctuations may not be suitable for P&F charts.
3. May require manual updating: P&F charts require manual updating as new price movements occur. This can be time-consuming and may lead to delays in analysis.
In summary, P&F charts can be a useful tool for traders, but they should be used in conjunction with other technical indicators and should not be relied on solely for making trading decisions. Traders should also be aware of the limitations of P&F charts and use them in combination with other analysis techniques.